|
English/Japanese |
Since the ultrasound measurement is non-invasive and its data acquisition rate is fast enough to get consecutive images, it is suitable to measure the velocity of blood flow.
To measure the velocity of blood flow, the color Doppler method, which represents velocity as hue, is widely used and has been obtaining satisfactory results in the cardiac diagnosis, such as the detection of mitral regurgitation.
However, a general ultrasound scanner can measure only one scanning plane at a time. Therefore, to understand the real flow across the scanning planes, the diagnostician must reconstruct a 3-D flow image from numerous slices in his mind. This process requires a high ability to grasp a 3-D space. Moreover, since the reconstructed 3-D image is subject to diagnostician's understanding, to share the same recognition between more than one diagnostician is difficult.
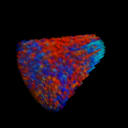
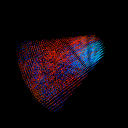
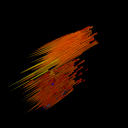
To solve these problems, the method which produces 3-D flow data from 2-D color Doppler images is effective. The method supplies the researchers with the objective insight of given 3-D flow. On the other hand, the amount of information becomes extremely large. Then the extraction of the information which the researcher wants to see has greater importance. There are a few studies of 3-D visualization of color Doppler images, but none of them becomes popular up to this day.
This research examines the visualization methods which meet the needs of diagnosticians in a computational environment.
| Transparent Cubes | Points | Arrows | Particle Tracking |
|
MPEG:2.86MB |
MPEG:4.24MB |
MPEG:3.84MB |
MPEG:5.07MB |
| back | e-mail: masata-i@is.aist-nara.ac.jp last update: Aug. 29, 2001 |